
Business Efficiency Accelerated
Tarvah unites data integration, analytics, AI decisioning, and business action into a single, powerful platform. Move from raw data to trusted insights in minutes, not weeks.
Tarvah Dashboard
May 2026 · Auto-refresh
Revenue
$4.2M
+12%
Margin
68%
+2pp
NPS
87
Stable
Efficiency
94%
+5%
Business Efficiency Index
↑ Trending upAI Recommendations
Approve 3 vendor contracts — within budget
Review APAC logistics spend anomaly
Ask Tarvah
"Why did Q2 margin drop?"
Logistics costs in APAC rose 12%, compressing margin by 2.1pp.
The barriers slowing your business down
Traditional BI tools leave critical gaps that compound into lost time, lost revenue, and missed opportunity.
Data Fragmentation
Siloed and disconnected data sources hinder analysis and slow decision-making across your organization.
Workflow Complexity
Overly complicated processes create inefficiencies, introduce errors, and drain engineering and analyst time.
Rigid Visualizations
Inflexible charts and graphs limit insightful exploration, leaving business users dependent on technical teams.
AI Integration Barriers
Difficulties embedding AI capabilities into existing systems block teams from turning data into decisions.
One Platform. Total Efficiency.
Tarvah unites data integration, analytics, AI decisioning, and business action. With the semantic business layer ensuring consistency and conversational AI making data accessible to everyone.
Data Simplicity
Universal connectors for any source
Workflow Efficiency
Visual pipeline automation
Business Modeling
Semantic layer with shared logic
Visual Engineering
AI-generated dashboards in minutes
AI Decisioning
Conversational AI on your business data
One Unified Platform
Connect data, analytics, AI, and action in a single integrated environment.
Robust Data Foundations
Built on solid data modeling, semantic layers, and enterprise-grade architecture.
Smarter Visualizations
Appropriate visualizations that facilitate business understanding at every level.
AI Powered Decisions
Obtain business insights quickly and make decisions with confidence.
Solid Data Foundations
Data Integration + Workflow + Semantic Business Model — the bedrock your analytics need.
Seamless Data Integration
- Connect to databases, cloud warehouses, APIs, flat files, and SaaS apps
- No manual data extraction or complex ETL processes
- Universal connectors — start analyzing immediately, wherever your data lives
Orchestrate Data Workflows
- Design and automate entire data pipelines with intuitive visual tools
- Schedule workflows, monitor execution, receive alerts on issues
- Built-in validation rules ensure data quality at every step
Semantic Business Data Model
- Define business logic, rules, metrics, and relationships once — use everywhere
- Single source of truth with business-friendly naming and calculations
- Automatic propagation to all downstream reports and dashboards
Raw Data → Business Model
5 sources · 27 transforms · live
Sources
Ingest
5 sources
Transform
27 rules
Validate
All clean
Business Model
Revenue KPI
$4.2M
+12% MoM
Gross Margin
68.4%
+2.1pp
Customer Score
87 / 100
Stable
Cost per Unit
$14.20
−8% YoY
Business Intelligence, Visually Engineered
Rich, intuitive visualizations powered by AI. From natural language to complete dashboards in seconds.
Describe in Plain English
Tell Tarvah what you need: "Show me sales trends by region with product breakdown"
AI Auto-Builds Dashboard
Within seconds, AI generates a complete dashboard with appropriate visualizations
AI Suggests Improvements
Get recommendations to enhance clarity, highlight key insights, and optimize layout
Run Experiments
Test different visualization approaches and let AI optimize for maximum business impact
Rich, Intuitive Visualizations
- Business flow-driven storyboards and executive summaries
- Geo-spatial maps and specialized BI chart types
- Interactive dashboards with cross-filtering and drill-throughs
- Drill-down capabilities — all with simplicity and speed
Tarvah Analytics Platform
Visual Intelligence · LiveSpend Heatmap
RTW 0–10Med Spends → · Indem ↑
Avg RTW · By Injury
n = 83,576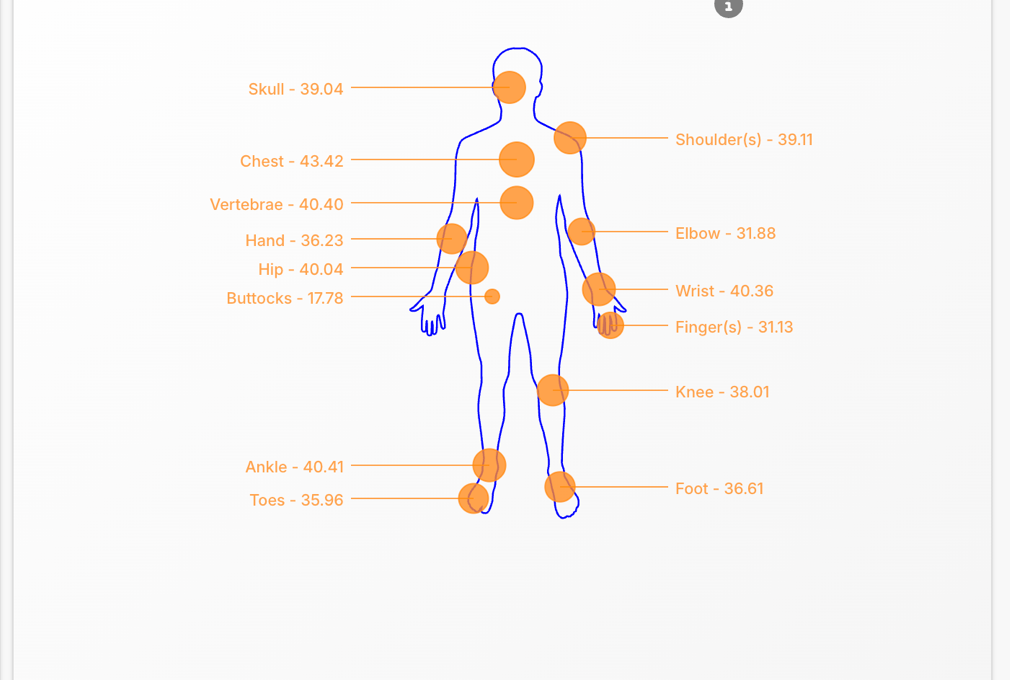
AI Decisioning Layer
Conversational AI + Embedded ML + AI Decisions — turning data into competitive advantage at the speed of thought.
Conversational AI on Business Data
Ask natural questions in plain English and get instant answers with charts and explanations.
- Natural language queries translated to data analysis
- Automatic generation of visual explanations
- Follow-up questions with context-aware understanding
- No SQL or technical skills required
Example questions
Integrated Machine Learning Models
Deploy forecasting, anomaly detection, scenario modeling, and prescriptive analytics with simple click-through integration.
- Time series forecasting with automatic seasonality detection
- Anomaly detection to surface unexpected patterns
- Scenario modeling for strategic planning
- "What-if" simulations instantly
Augment Business Decisions with AI
Make faster, smarter, more confident decisions backed by objective data. AI is your trusted decision partner.
- Predictive insights surface before problems escalate
- Prescriptive recommendations guide optimal actions
- Confidence intervals quantify uncertainty
- From strategic planning to operational execution
Deploy Anywhere. Govern Everywhere.
Lower friction, higher adoption, and full compliance — on your terms.
Deploy Anywhere
Your infrastructure, your rules
- Cloud-native on AWS, Azure, or GCP for speed and scalability
- On-premises deployment for maximum data control and compliance
- Hybrid configurations that seamlessly span cloud and on-prem environments
- Kubernetes-native deployment for ultimate portability and orchestration
Govern Everywhere
Enterprise security & compliance built-in
- SAML/SSO integration with your existing identity providers
- Granular Role-Based Access Control (RBAC)
- Row and column-level data security
- Seamless embedding into core operational systems
- Full enterprise security, governance, and compliance
Superior ROI vs. Leading BI Platforms
Tarvah delivers significantly faster time-to-value and higher ROI compared to traditional data analytics and BI systems — accelerated by our semantic layer and AI capabilities.
| Benefit | Traditional BI | Tarvah |
|---|---|---|
| ROI (3 years) | 150–185% | 250%+ |
| Payback Period | 6–13 months | <4 months |
| Dashboard Creation | Days | Minutes |
| Time-to-Insight | Hours/Days | Seconds–Minutes |
| Data Prep Effort | Moderate–High | Low (>50% reduced) |
| User Adoption | Moderate–Strong | High (AI-assisted) |
Competitor data sourced from Forrester Total Economic Impact studies. Tarvah outcomes are estimated based on customer results.
Real-World Impact Across Industries
From financial services to logistics, Tarvah delivers measurable results where it matters most.
Workers Compensation Insurance
- Reduced losses from ICD code mismatches in medical spend
- Improved return-to-work rates for musculoskeletal injury claims
Carrier & Forwarding
- Prevented margin erosion from subtle operational leakages
- Identified savings through FTA concessions
- Monitored and reduced direct shipment job losses
Capital Markets
- Automated detection of post-trade breaks and reconciliations
- Flagged trade settlement discrepancies instantly
- AI-based monitoring for securities transaction compliance
Workforce Management
- Improved oversight of resource deployment and utilization
- Detected and addressed billing and payment deviations
Ecommerce Pricing Analytics
- Tracked and improved seller performance across sales and pricing
- Identified competitor pricing patterns by category and SKU
Portfolio Risk
- Track, analyze, and benchmark fund performance
- Identify risks, run forecast models, and simulate scenarios
Unlock value from day one.
Less complexity, more confidence.
See how Tarvah can help your team deliver stronger ROI through smarter analytics, faster adoption, and simpler execution.
Schedule a Demo
Request received!
We'll be in touch shortly to schedule your demo.
Or email us directly at connect@scenai.com