TARVAH
A simple and effective tool in the hands of a Business User
Traditionally business users have depended on data visualizers/ data scientists / IT professionals to generate visual insights of the data. After considerable time for the generation of the visual insights, the business user now has to spend time to look among those insights that help to create actionable strategies and business decisions. This process is pretty cumbersome and in order to ease and make it simpler for business users – Tarvah was designed.
Tarvah is an enterprise SaaS (Software As A Service) tool which directly enables the business user without the help of an expert (IT professional or Visualizer) to generate actionable Visual insights from the data and in turn identify from them actionable business strategies and business decisions.
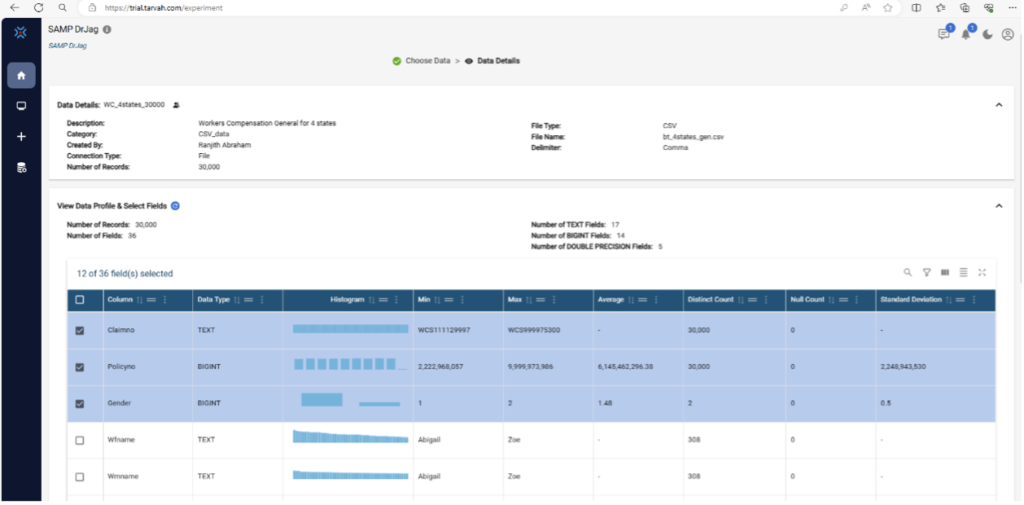
In short, empowering business users with the power of data to visually explore it with a click of a button as shown in the example below – details of a Workers Compensation data file.

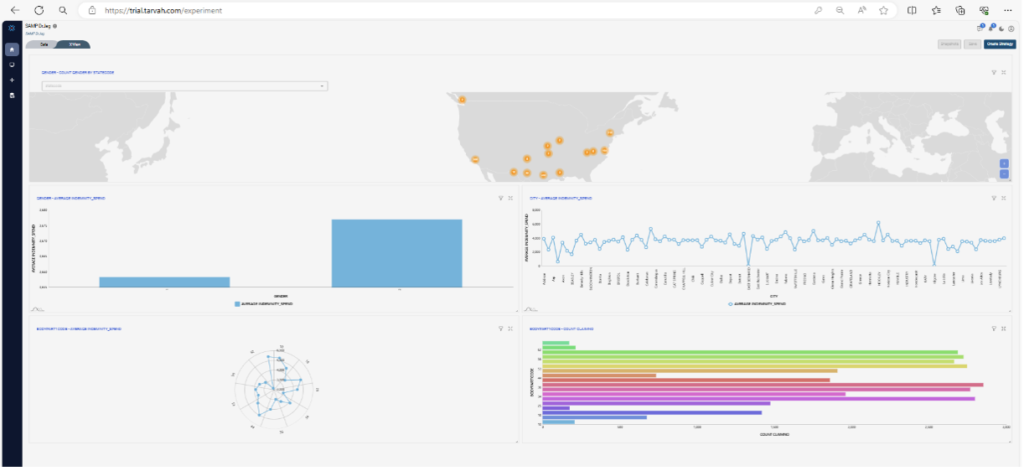
Glean insights and perform business experiments as shown with a sample below – using a few clicks of your mouse and choosing the right chart or graph from a drop-down.

The business user by doing so brings the analytical mind set – analysing and correlating the data using a multitude of visual angles and data combinations. Eventually the business user can correlate business objectives from the visual data insights.
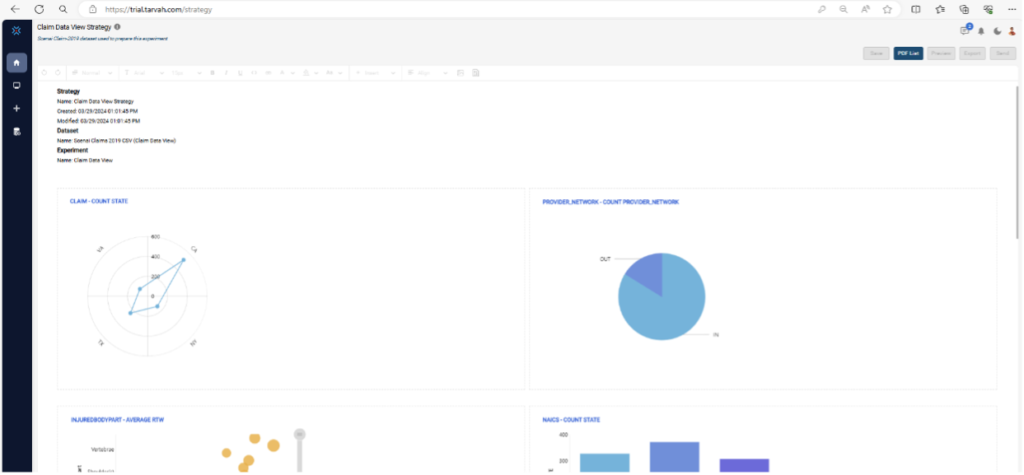
Thereafter the visual insights can be meaningfully translated into Value propositions to be consumed by the operational systems. A sample Strategy for Workers Compensation is partially shown below.

More than anything is the Graphical User Interface which helps the business user to Navigate and perform work using the tool. Much of the work is auto-generated and includes connecting to data sources quickly, auto-generated visualizations and strategies and their publications through interfaces for operational use.

In short, business users can get quickly started and rapidly realize value using TARVAH.


